
Have you ever wondered how the insights tab on your educator dashboard can help you grow your online teaching business? Don’t worry if you’re unsure about how to navigate the page. We’re here to help!
What’s an insight?
Your personalized insights tab is a collection of metrics that can give you crucial insights to help you build your teaching business and meet your goals. In this article, you will learn how to access and interpret the data provided in your Outschool dashboard. You will learn where to find your data, what it means, and what to do about it.
Your educator dashboard
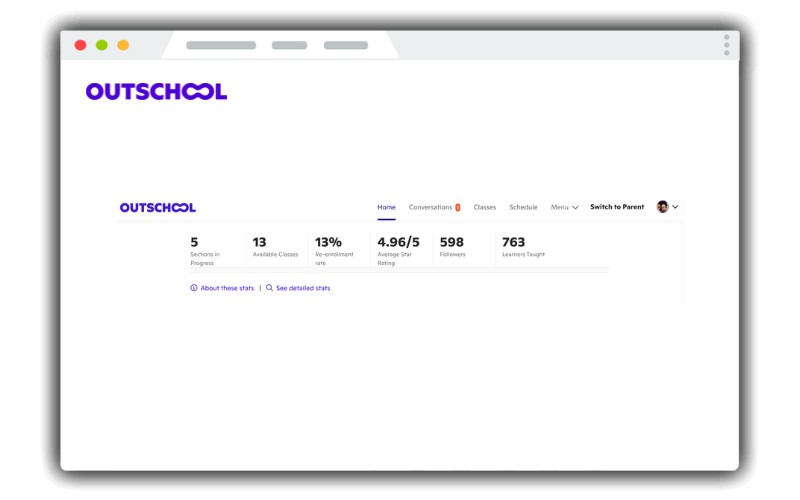
The educator dashboard is visible only to you and provides overview data of your performance on Outschool. On the homepage of your dashboard, you’ll see things like sections in progress, followers, and learners taught, as well as quality indicators like re-enrollment rate and average star rating.
Your re-enrollment rate is calculated by taking all learners who have taken 2 or more classes with you and dividing it by all learners who have ever taken a class with you.
Your average star rating is calculated by averaging all the reviews from all classes you’ve taught—regardless of whether they are currently listed.
Understanding the metrics
Outschool provides families and educators with a wide range of data that can impact decisions on the platform. Parents may use teacher star rating, class star rating, number of reviews, and learners taught to inform their enrollment choices. Educators may use metrics to identify successful classes and make informed decisions about new class/section offerings, increasing enrollments, and improving star ratings.
Let’s walk through each of the stats listed on your insights page.
Detailed Stats
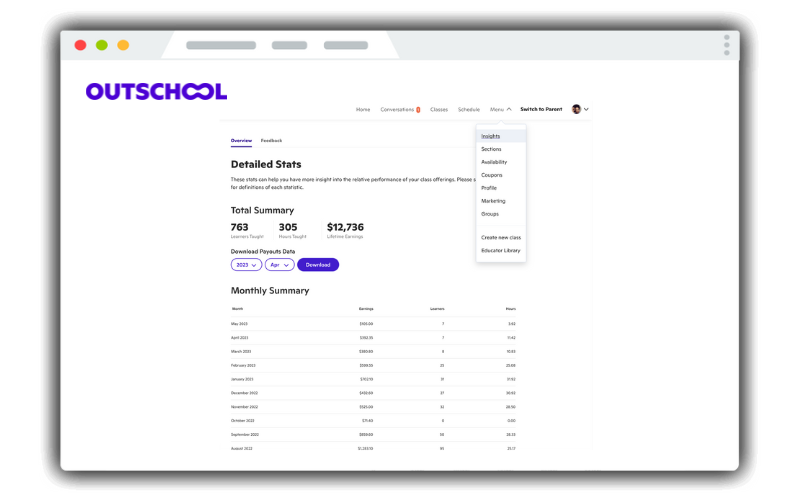
On your dashboard, you will see two tabs at the top of the page. One is “Overview” and the other is “Feedback.”
On the top you have access to your earnings, learners taught, and hours worked by month and year. Here, you can see statistical breakdowns of all the different classes you have taught in the last 90 days.
This class-level data can be used to make strategic decisions about class offerings. You can quickly identify classes that are:
- Generating the most revenue
- Receiving the highest rating
- Have the highest review rates
- Garnering the most saves
This can be helpful in having a clearer understanding of your most popular and successful classes.
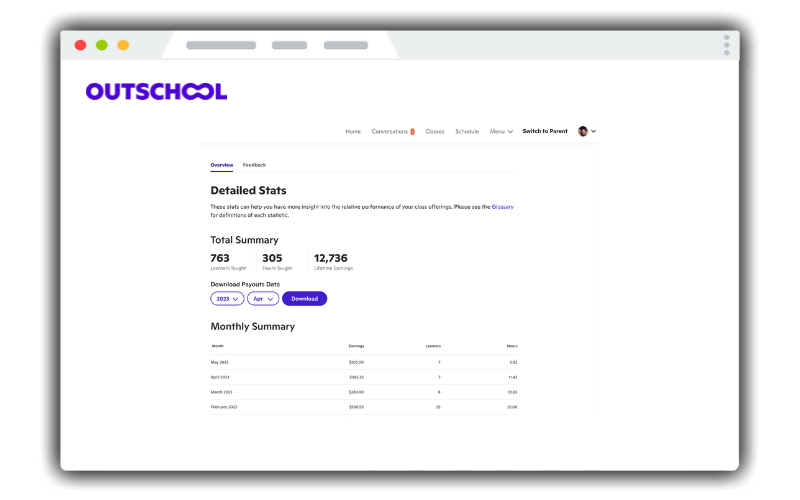
Total Summary
The first thing you will see on the Overview page is your Total Summary. Consider this section as a glimpse into every class you’ve taught as an Outschool educator.
Monthly Summary
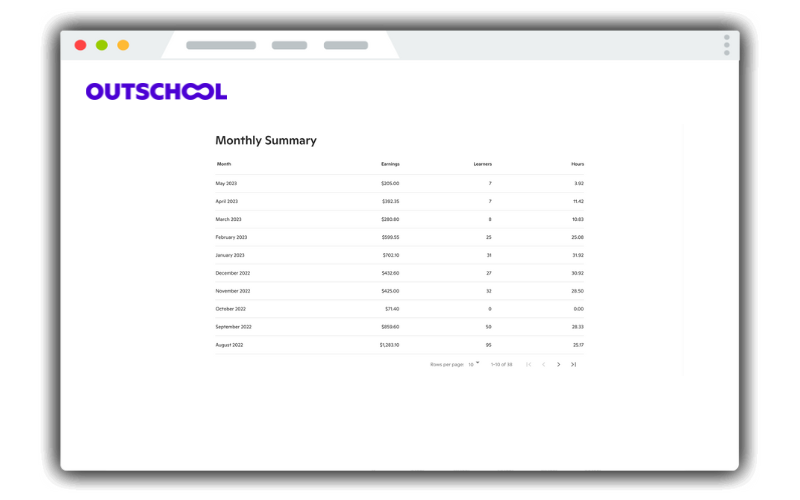
Scrolling down, the next tool on the Overview page is the Monthly Summary. Here, you will find a breakdown of your earnings, the number of learners taught, and the hours you worked by month.
Use your monthly stats to look for patterns and trends. Is there a month that is consistently higher year over year? Are there months that have fewer learners? Is this because you offered fewer classes or did you change anything, such as the class type, topics you’re teaching, etc., that may have caused the fluctuation in numbers?
For more information on how to grow your monthly numbers, be sure to check out these articles from the Educator Library:
- Spark student interest with online seasonal classes
- Navigating seasonal shifts in enrollments
- How to attract new learners as an online tutor
- How to start an online tutoring business
Yearly Summary
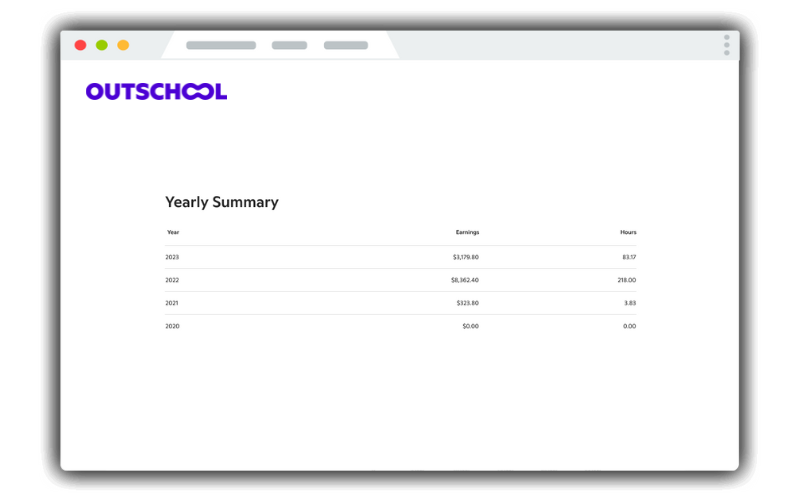
The next tool on your Overview page is your Yearly Summary. In this section, you will find insights about how much you earned and the hours taught by year. For educators who’ve been on the platform for more than a year, you can compare this information year over year to see what’s changed. If your earnings went up, is it because you added more classes and taught more hours? If your earnings are down, do your hours worked also decrease?
For more information on how to grow your monthly numbers, be sure to check out these articles from the Educator Library:
- Tap into student passions with online clubs
- 5 tips for online teaching success without additional marketing
- Marketing your classes to homeschool families
Class Breakdowns – Last 90 Days
At the bottom of your Overview page, you will see a section breaking down your classes with the number of unique viewers in the last 90 days (including your own). This metric updates once a day. This insight is incredibly useful, especially if you are constantly creating and trying new classes to see what works best. Let’s take a look at each of the categories below.
Sections
The number of started or completed sections of class with a learner enrolled. Use your sections to figure out which ones have the most learners. Is there a specific day of the week or time of the day that has more learners than others? Is there a certain topic or class that has a high enrollment rate than another? Use these metrics to filter out which classes are helping you earn the most.
Learners
The number of past and current learners enrolled in each class. A learner with multiple enrollments is only counted once. Withdrawn learners are excluded. This section offers you insights that may help you build funnels to get more re-enrollments to retain learners. Use these numbers to see which type of classes your learners are more likely to join. For example, if most of your learners register for ongoing classes, consider opening more sections at different times.
Hours
This metric represents the number of hours of class time taught per class. It is calculated on the meetings scheduled for sections with enrollments. (This doesn’t count flex classes.) Use this section to see where the majority of your in-class hours are being spent. Keep in mind how many outside hours you are dedicating to creating lesson plans, checking work, and giving feedback. If possible, apply the Pareto Principle, also known as the 80/20 rule, to determine which classes provide the biggest returns for the amount of time and energy you put in.
Earnings
In this section, you can see the total earnings you have received in payouts from Outschool per class. This counts earnings after they are sent via Paypal, within the last three months. Filter your earnings from highest to lowest to see which classes are paying out the most. Look to see the reasoning behind your highest-paying classes. Are there more learners? Is it a longer class, such as a semester-long course? If you market your classes outside of Outschool see if this is reflected in your earnings.
Re-enrollment Rate
The percentage of learners who enrolled in this class, who then enrolled in another class of yours. As mentioned above, the re-enrollment section is a great way to see how many learners are coming back for more classes. If you find that your re-enrollment rate is low, consider creating funnels or offering coupons to currently enrolled learners to promote upcoming classes.
Enrollments
Under the enrollments section, you can see the number of newly purchased enrollments for each class. This metric updates once a day, but please note that it does not count withdrawn enrollments from the last 90 days. Here, you can look for patterns. Do you notice that there is a specific time of year when your enrollments increase or decrease significantly? If so, learn more about how you can navigate seasonal shifts to get more enrollments.
Rating
Families tend to look at an educator’s rating when checking out a new class, which means you should too. The average star rating for the class is based on parent feedback. When looking at your ratings consider what the families have to say and which classes they reviewed. Consider what you did with each class and know that even veteran educators get a negative review from time-to-time. Look at positive reviews and note what families like or appreciated the most. Was it just the topic that interested them or was it the way you managed the classroom and led the discussion? The more you know about what is working well, the more you can apply it in future classes.
Reviews
If you’re new to Outschool, you may want to start by focusing on obtaining more reviews. To do this, you want to start by building a positive reputation as an Outschool educator. While you’re welcome to kindly ask families who’ve completed your classes to leave a review once the class is over, we do not encourage offering discounts or free classes to get reviews.
Saves
The number of parents who saved that class.
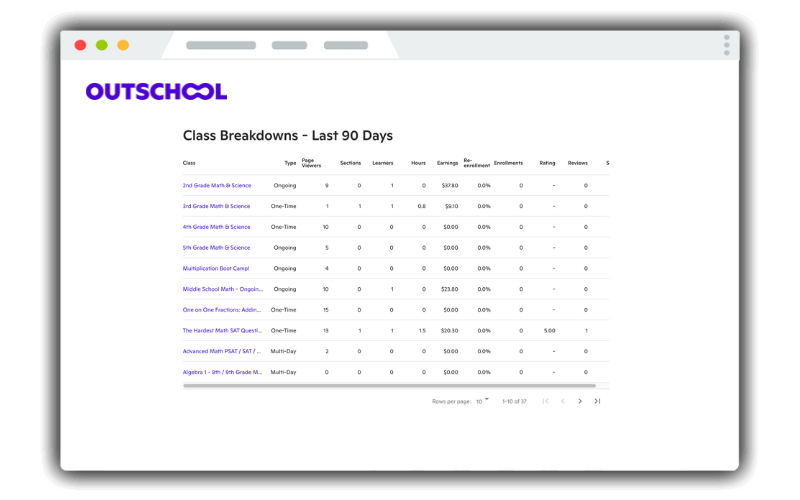
By clicking on the categories at the top of the table, you can filter the stats to look at one area at a time. For example, if you offer multiple types of classes (one-time, ongoing, multi-day, and flex), you may want to see which classes are generating the most income. Choosing the type category allows you to see a grouping of each class type. The same can be done for all of the categories in this section.
If you want to see which classes earned the most money, click on earnings so that it displays the highest earners at the top. Use this information to weed out which classes are not as profitable so that you can focus on those that are.
As an online educator, your time is valuable! Use these metrics to figure out what is working best for your online teaching business and which areas are more work than they are worth. Keep in mind that classes that are underperforming may be better suited as flex options. Consider freeing up your live teaching time by creating flex classes for classes that are not top earners.
For more information on how to grow your monthly numbers, be sure to check out these articles from the Educator Library:
- Create class funnels to keep learners coming back
- 6 ways to increase enrollments using easy marketing tools
Things to consider in your class breakdowns
Saves
If a class has a lot of saves, you may want to offer more sections —a save could indicate that families are interested but unable to enroll at that time!
Earnings/Hours
Look at the classes with the highest earnings per hour. These are the most economically efficient uses of your time.
Re-enrollment
A higher re-enrollment rate indicates these are classes that generate a recurring learner base. These classes are key to helping you build your following; use these classes to help inform what your course catalog and teacher brand might look like.
Ratings
Look for classes that might be outliers on the low side. If you continue to get low reviews, it could adversely impact your ability to get enrollments in other classes.
If you have any questions regarding your educator dashboard insights, please refer to our FAQs.
For more helpful insights on how to grow your online teaching business, be sure to check out Outschool’s insights page. You can access the Educator Handbook for more tips and strategies to market your business and stay on top of Outschool’s latest teaching and curriculum insights. You can also access the Business Toolkit with tools and resources to get you started. On the Insights page, you will have access to what’s trending, in demand, and which classes Outschool families are searching for. And that’s just the beginning!
Be sure to take a moment to read Educator Stories about educators just like you, join the Outschool community, and become an ACE educator.
